INTRODUCTION TO 6 SIGMA
Six Sigma is a method that provides organizations tools to improve the capability of their business processes. This increase in performance and decrease in process variation lead to defect reduction and improvement in profits, employee morale, and quality of products or services. Six Sigma quality is a term generally used to indicate a process is well controlled (within process limits ±3s from the center line in a control chart, and requirements/tolerance limits ±6s from the center line).
Different definitions have been proposed for Six Sigma, but they all share some common threads:
- Use of teams that are assigned well-defined projects that have direct impact on the organization’s bottom line.
- Training in “statistical thinking” at all levels and providing key people with extensive training in advanced statistics and project management. These key people are designated “Black Belts.” Review the different Six Sigma belts, levels and roles.
- Emphasis on the DMAIC approach to problem solving: define, measure, analyze, improve, and control.
- A management environment that supports these initiatives as a business strategy.
A BRIEF HISTORY ABOUT 6 SIGMA
Six Sigma is a set of techniques and tools for process improvement. It was introduced by engineer Bill Smith while working at Motorola in 1986. Jack Welch made it central to his business strategy at General Electric in 1995. Today, it is used in many industrial sectors.
Six Sigma seeks to improve the quality of the output of a process by identifying and removing the causes of defects and minimizing variability in manufacturing and business processes. It uses a set of quality management methods, mainly empirical, statistical methods, and creates a special infrastructure of people within the organization, who are experts in these methods. Each Six Sigma project carried out within an organization follows a defined sequence of steps and has specific value targets, for example: reduce process cycle time, reduce pollution, reduce costs, increase customer satisfaction, and increase profits.
The term Six Sigma (capitalized because it was written that way when registered as a Motorola trademark on December 28, 1993) originated from terminology associated with statistical modeling of manufacturing processes. The maturity of a manufacturing process can be described by a sigma rating indicating its yield or the percentage of defect-free products it creates. A six sigma process is one in which 99.99966% of all opportunities to produce some feature of a part are statistically expected to be free of defects (3.4 defective features per million opportunities). Motorola set a goal of “six sigma” for all of its manufacturing operations, and this goal became a by-word for the management and engineering practices used to achieve it.
Differing opinions on the definition of Six Sigma:
Philosophy— The philosophical perspective views all work as processes that can be defined, measured, analyzed, improved and controlled. Processes require inputs (x) and produce outputs (y). If you control the inputs, you will control the outputs. This is generally expressed as y = f(x).
Set of tools— The Six Sigma expert uses qualitative and quantitative techniques to drive process improvement. A few such tools include statistical process control (SPC), control charts, failure mode and effects analysis, and process mapping. Six Sigma professionals do not totally agree as to exactly which tools constitute the set.
Methodology— This view of Six Sigma recognizes the underlying and rigorous approach known as DMAIC (define, measure, analyze, improve and control). DMAIC defines the steps a Six Sigma practitioner is expected to follow, starting with identifying the problem and ending with the implementation of long-lasting solutions. While DMAIC is not the only Six Sigma methodology in use, it is certainly the most widely adopted and recognized.
Metrics – In simple terms, Six Sigma quality performance means 3.4 defects per million opportunities (accounting for a 1.5-sigma shift in the mean).
What is lean Six Sigma?
Lean Six Sigma is a fact-based, data-driven philosophy of improvement that values defect prevention over defect detection. It drives customer satisfaction and bottom-line results by reducing variation, waste, and cycle time, while promoting the use of work standardization and flow, thereby creating a competitive advantage. It applies anywhere variation and waste exist, and every employee should be involved.
The Key Principles of Lean Six Sigma
- Focus on the customer.
- Identify and understand how the work gets done (thevalue stream).
- Manage, improve and smooth the process flow.
- Remove Non-Value-Added steps and waste.
- Manage by fact and reduce variation.
- Involve and equip the people in the process.
- Undertake improvement activity in a systematic way.
Sigma Six: The Methodology Explained
The term “six sigma process” comes from the notion that if one has six standard deviations between the process mean and the nearest specification limit, as shown in the graph, practically no items will fail to meet specifications. This is based on the calculation method employed in process capability studies.
Capability studies measure the number of standard deviations between the process mean and the nearest specification limit in sigma units, represented by the Greek letter σ (sigma). As process standard deviation goes up, or the mean of the process moves away from the center of the tolerance, fewer standard deviations will fit between the mean and the nearest specification limit, decreasing the sigma number and increasing the likelihood of items outside specification. One should also note that calculation of Sigma levels for a process data is independent of the data being normally distributed. In one of the criticisms to Six Sigma, practitioners using this approach spend a lot of time transforming data from non-normal to normal using transformation techniques. It must be said that Sigma levels can be determined for process data that has evidence of non-normality.
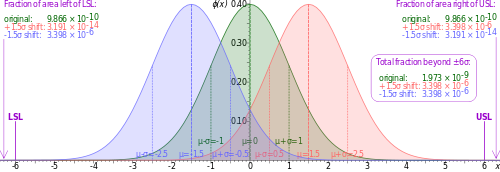
Graph of the normal distribution, which underlies the statistical assumptions of the Six Sigma model. The Greek letter σ (sigma) marks the distance on the horizontal axis between the mean, µ, and the curve’s inflection point. The greater this distance, the greater is the spread of values encountered. For the green curve shown above, µ = 0 and σ = 1. The upper and lower specification limits (USL and LSL, respectively) are at a distance of 6σ from the mean. Because of the properties of the normal distribution, values lying that far away from the mean are extremely unlikely. Even if the mean were to move right or left by 1.5σ at some point in the future (1.5 sigma shift, colored red and blue), there is still a good safety cushion. This is why Six Sigma aims to have processes where the mean is at least 6σ away from the nearest specification limit.
1-6 sigma conversion table:
| ‘Long Term Yield’ (basically the percentage of successful outputs or operations) % |
Defects Per Million Opportunities (DPMO) | ‘Processs Sigma’ |
| 99.99966 | 3.4 | 6 |
| 99.98 | 233 | 5 |
| 99.4 | 6,210 | 4 |
| 93.3 | 66,807 | 3 |
| 69.1 | 308,538 | 2 |
| 30.9 | 691,462 | 1 |
You can see from the conversions above that the sigma scale is exponential. The difference between the DPMO equating to each whole number more than doubles as you move up through the scale. Motorola and many other devotees of Six Sigma are increasingly at pains to point out that Six Sigma is nowadays far less concerned with the mathematical theory of the Sigma calculations, and a lot more concerned with the model’s broader performance improvement methods, nevertheless, Six Sigma’s complexity and variable interpretations are not helped by the difficulty in penetrating the original mathematical reasoning behind the essential Six Sigma metric
Six Sigma Processes
There are two Six Sigma methodologies: Six Sigma DMAIC and Six Sigma DMADV, each term derived from the major steps in the process.
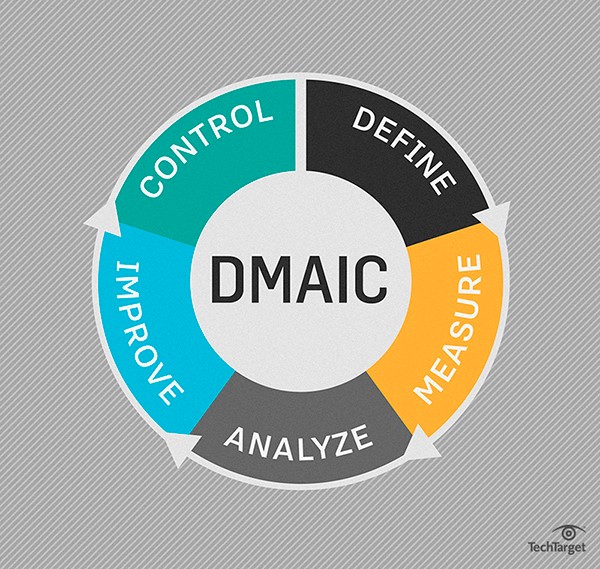
Six Sigma DMAIC
Six Sigma DMAIC defines, measures, analyzes, improves and controls existing processes that fall below the Six Sigma specification. Here is a step-by-step breakdown of Six Sigma DMAIC:
- Define: Identify the project goals and all customer deliverables.
- Measure: Understand current performance.
- Analyze: Determine root causes of any defects.
- Improve: Establish ways to eliminate defects and correct the process.
- Control: Manage future process performance.
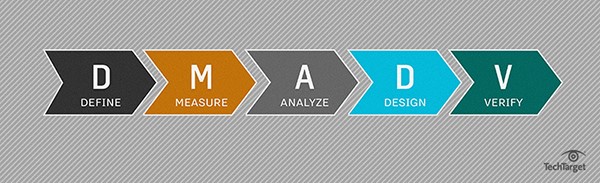
Six Sigma DMADV or DFSS
Six Sigma DMADV is a process that defines, measures, analyzes, designs and verifies new services or products intended to attain Six Sigma quality. The first three steps of this methodology are identical to DMAIC.
- Define: Identify the project goals and all customer deliverables.
- Measure: Understand current performance.
- Analyze: Determine root causes of any defects.
- Design: Create a process that meets customer needs and expectations.
- Verify: Ensure process designed meets customer needs and performs adequately.
When contemplating Six Sigma DMAIC versus DMADV, it is important to understand the circumstances in which each should be used. The DMAIC methodology should be used when an existing product or service is not meeting customer needs or performing to its highest standards. The DMADV methodology should be used when an organization is developing a new product or service, or when using DMAIC for a current project or process fails.
Six Sigma tools
Six Sigma methodology and projects tend to rely heavily on Six Sigma tools. Some project professionals, in fact, believe, that this method over-relies on Six Sigma tools. Critics claim that sometimes more attention is paid to reducing variation and searching for any significant factors and less attention is paid to developing robustness in the first place because Six Sigma project members focus too much on sticking to Six Sigma tools.
Six Sigma tools and projects emphasize the importance of testing and using Six Sigma tools, such as multiple regression techniques increases the risk of making commonly-unknown types of statistical errors or mistakes. A possible consequence of Six Sigma’s array of P-value misconceptions is the false belief that the probability of a conclusion being in error can be calculated from the data in a single experiment without reference to external evidence or the plausibility of the underlying mechanism.
Six Sigma tools are mainly statistical tools. These are valid instruments for information analysis and process management, however, Six Sigma project members should avoid using them blindly. To summarize, Six Sigma tools include a few dozen of points:
- 5 Whys
- Poka Yoke
- 5S
- Process Mapping
- Affinity Diagram/KJ Analysis
- Project Charter
- Analysis of Variance (ANOVA)
- Pugh Matrix
- Analytic Hierarchy Process (AHP)
- QFD/House of Quality
- Brainstorming
- RACI Diagram
- Calculators
- Regression
- Capability Indices/Process Capability
- Risk Management
- Cause & Effect
- SIPOC/COPIS
- Control Charts
- Sampling/Data
- Design of Experiments (DOE)
- Simulation
- FMEA
- Software
- Graphical Analysis Charts
- Statistical Analysis
- Hypothesis Testing
- Surveys
- Kanban
- Templates
- Kano Analysis
- Value Stream Mapping
- Measurement Systems Analysis
(MSA)/Gage R&R - Variation
- Normality
- Wizards
- Pareto
When it comes to planning a Six Sigma project, project team members look into Six Sigma tools they are about to use, and plan their Six Sigma project accordingly. Six Sigma tools are frequently associated with project roles and Six Sigma belts, which outline which tools every team member should use depending on his/her belt level.
Achieving Six Sigma Certifications
Unlike most other certification programs, Six Sigma does not have a centralized certifying body that manages and carries out certifications. Most Six Sigma certifications are either tied to the companies and target their staff, or are available from independent providers. This explains a variety of training materials available for Six Sigma certification exam preparation. Overall, depending on the level of your expertise and professional background, you need to choose one of the following Six Sigma Certification levels:
- Lean Six Sigma Black Belt
- Lean Six Sigma Green Belt
- Lean Six Sigma Master Black Belt
- Lean Six Sigma Yellow Belt
- Six Sigma Lean & DFS
Required Experience
Six Sigma Green Belts are employees who spend some of their time on process improvement teams. They analyze and solve quality problems, and are involved with Six Sigma, lean or other quality improvement projects. The Six Sigma Green Belt certification requires three years of work experience in one or more areas of the Six Sigma Green Belt Body of Knowledge. Work experience must be in a full time, paid role. Paid intern, co-op or any other course work cannot be applied towards the work experience requirement. Educational waivers are not granted.
Minimum Expectations for a Certified Six Sigma Green Belt
- Operates in support of or under the supervision of a Six Sigma Black Belt
- Analyzes and solves quality problems
- Involved in quality improvement projects
- Participated in a project, but has not led a project
- Has at least three years of work experience
- Has ability to demonstrate their knowledge of Six Sigma tools and processes
Examination
Each certification candidate is required to pass a written examination that consists of multiple choice questions that measure comprehension of the Body of Knowledge. The SSGB examination is a one-part, 110-question*, four and a half hour exam.
Examinations are conducted throughout the year and are delivered via computer based testing (CBT) through ASQ’s testing partner Prometric. All examinations are open-book. Each participant must bring his or her own reference materials. Use of reference materials and calculators is allowed.
Six Sigma Certification Process
Six Sigma certification process preparation depends on the company you work for, country you live in, and how popular/accepted Six Sigma is in your professional environment. Overall, choosing the right Six Sigma exam preparation materials that can get you certified fast. More importantly, these materials need to contain real Six Sigma exam questions and answers that have been verified by experienced Six Sigma professionals who hold Six Sigma Lean Black Belt certifications. Our preparation materials tick all the boxes, including real questions and answers, which have been reviewed and verified by experienced holders of top Six Sigma certifications.
The Body of Knowledge for certification is affected by new technologies, policies, and the changing dynamics of manufacturing and service industries. Changed versions of the examination based on the current Body of Knowledge are used at each offering.
Value of Six Sigma Certification
- Value to the individual
- Higher salary on average
- Greater self confidence – with the ability to summon the power of problem solving at your disposal, feeling much more confident as an individual
- It teaches the individual how to think like a leader – also makes him result oriented; it also teaches, how to huddle a team around a cause and lead them to success.
- The the individual finally gets a Black Belt title.
- Value to the company
- They get a problem solving wizard. There are very few jobs on the face of this planet that do not require some sort of problem solving ability. It’s essential for most management level positions. (That’s why many jobs in my former GE would indicate a Six Sigma requirement on the job posting).
- Massive gains. A Six Sigma Black Belt project is usually in the $MM range in terms of savings gains (efficiency, cost redurction, cycle time, etc.). That pay the man’s salary several times over in just a single initiative.
Certification Cost
The cost for the IASSC Certified Black Belt Exam is $395 USD. The cost for the IASSC Certified Green Belt Exam is $295 USD. The cost for the IASSC Certified Yellow Belt Exam is $195 USD. There are no other charges associated with these certifications.
India
Six Sigma Green Belt Certification has no recertification requirements. It is a lifetime certification. *Rs 4,600 of your fee is an application fee, and is not refundable.
Major Loopholes and Drawbacks of 6-Sigma
- Lack of originality
- Inadequate for complex manufacturing
- Role of consultants
- Potential negative effects
- Over-reliance on statistical tools
- Stifling creativity in research environments
- Lack of systematic documentation
Summary
The given article is a case study of the application of the DMAIC-six sigma methodology in order to reduce delays in delivering garments, for a Tunisian factory.
Problem faced : Being a labour-intensive factory dealing with small sized orders, frequently changing styles, and shorter lead times, and facing increasing competition, there are productivity and quality issues leading to delays in the delivery as per the planned time.
DMAIC refers to a data-driven quality strategy for improving processes and is an acronym for r five interconnected phases: Define, Measure, Analyze, Improve, and Control.
Define phase : The goal of this phase is to define the strategic direction of the organization, develop the problem statement, identify the team, define the resources, evaluate the key organizational support, develop the project plan and milestones and develop the high level process map.
Measure phase : This phase set measures for the strategic objectives of the organization, define defect and opportunity, detailed process map of appropriate areas, develop data collection plan, validate the measurement system, collect the Data and determine process capability and Sigma Baseline.
Analyse phase : The aim of this phase is to define performance objectives, identify Value/Non-Value Added Process Steps and identify sources of variation.
Improve phase : The objective is to identify the opportunities for improvement and convert them to Six Sigma projects for improvement, perform design of Experiments, develop potential solutions, define operating tolerances of potential system and validate potential improvement by Pilot Studies.
Control phase : Set up a management control action of continuous reviews on the improvements made on the Six Sigma Projects. The goal is to define and validate monitoring and control system, develop standards and procedures, implement statistical process control, determine process capability and develop the transfer.
Application of six sigma DMAIC Methodology :
Define Phase : The project is first defined, and the voice of the customer (VOC) and a SIPOC (suppliers, inputs, process, outputs and customers) diagram is established in order to determine the required outcome (Y). A survey is done for the VOC.
Then, a detailed work plan is created including the milestones, tasks, deadlines and resources for each task. The start and end points, human and material resources, tasks during DMAIC project, duration of each task with required resources and the schedule (using GANTT chart) are established. This makes for the Plan Package for the next step.
Measurement phase : Y=f(X) concept of DMAIC , where Y is the project outcome. This steps focuses on determining the input Xs to get the outcome Y.
Process Mapping : This tool is used to understand, analyse processes and activities in the project and assist in identifying opportunities for improvement.
Flowcharting : This is done to depict the nature and flow of the steps in the process for clear understanding and then trying better deployment.
Mapping the Order Fulfilment Process (OFP) : This is carried out by the team leader, build up several steps ensuring the involvement of team members in the mapping process. The leader created a high- level flow (context) diagram, discusses the flow, key inputs and outputs, creates the value stream map and conducts meetings to interpret the flowcharts with team members.
Data Collection Plan : Several crucial steps need to be addressed to ensure that the data collection process and the measurement system are stable and reliable. Incorporating these steps into a data collection plan improve the likelihood that the data and measurements can be used to support the ensuing analysis and answer questions about data collection.
Analyse Phase : Through analysis, the team can determine the causes of the problem that needs improvement and how to eliminate the gap between existing performance and the desired level of performance. Statistical and graphical application for data analysis is carried out by the leader.
Improve phase : The main goal of this phase is providing Designers and Developers of the new ERP system with improvement solutions that may be integrated further in the design and development of the ERP system. These solution must be directly addressed to X’s metrics to improve Y.
Scheduling Procedure : This procedure ensures the involvement of the factories personnel in the product life cycle, especially in planning and resources management. It also helps it helps to share decisions with Tunisian personnel who can consider decisions in light of the current production process situation. Finally, monitoring the production scheduling in Tunisia eliminates wait times in taking the right decisions, minimizes the number of non-added value steps, and drives the factories to monitor all the garment life cycle.
The order for all processes is determined and prioritized.
Pull system development : Implementing Pull Systems can help to eliminate waste in handling, storing, and getting the product to the customer. Pull Systems are an excellent tool to use in the areas where flow manufacturing cannot be achieved.
Lead Time and WIP : The lead time of any process is amount of time taken between the entry of work into a process and the time to completion process
Total Lead Time = (No. of things in process/Avg completion rate)
One of the core principles of Six Sigma is that you have to reduce TIP(things in process) for delivering work faster and reducing waste in the processes.
Reduce WIP using Pull System:
The essence of a pull system is that work enters a process at the same rate at which it exits. Since the “exit rate” is controlled by customer demand that means the process is paced to meet the customers’ needs
First, the cap amount of work is determined, followed by the creation of input buffer. The planning is done using the first component of the pull system which is sorting application, the program calculated the average completion rate of each assembly line based on average Absenteeism and Yield, then it enters to the process (cutting then sewing process) the managed WIP.
Pull/Kanban Deployment : Project Leader suggests the deployment of Kanban in the factories. Kanban cards will be an output of the Pull system computerized application.
The process steps are :
- State 1: Order planned
- State 2: Order cut
- State 3: Order delivered to workshop
- State 4: Order launched
- State 5: Order sewed
- State 6: Order packed in the box
After each process step, stuck Kanban card will be removed from the paper then putted into box. This system will allow any manager to check the current situation of the process simply by checking the box which contains Kanban cards. At any moment, the flow of material is easily controlled and the real state of any order is monitored.Hence, Pull/Kanban system implementation focuses on scheduling and supervising the production runs
Control Phase : In the Control phase, tools are put in place to ensure that the key variables remain within the acceptable ranges over time so that process improvement gains are maintained.
Statistical Process Control Deployment : Statistical process control is the application of statistical methods to identify and control the special cause of variation in a process. Statistical Process Control (SPC) is the equivalent of a histogram where every new point is statistically compared with previous points as well as with the distribution as a whole in order to assess likely considerations of process control (i.e. control, shifts, and trends). SPC uses such basic statistical quality control methods as quality control charts.
Thanks for Contribution