
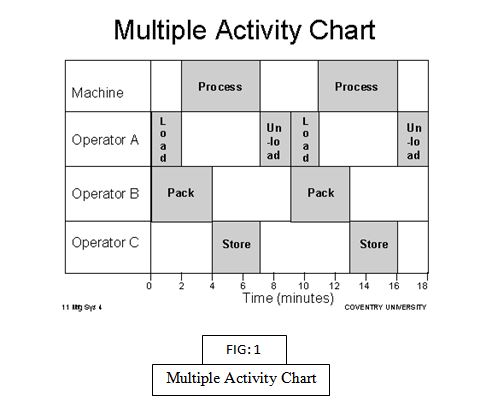
Multiple activity charts are the process charts using a time scale. It usually comes in picture when work study man wants to record the activities of one subject with respect to other on a single chart. Subject may be the worker, machine or equipment.
Multiple Activity Charts are a very useful tool for understanding the flow of work in a cyclical process and as a consequence understanding which resource is controlling the overall progress of the work. The tool can be used to model different scenarios to determine the optimum mix of resources for the work.
It is a very simple technique that can provide valuable insights to help optimize any cyclical process that involves several different resources. They can also provide a valuable tool for monitoring progress in critical situations where a detailed understanding of the workflow is needed. They serve as useful devices to assist in the redistribution and balancing of workloads.
Objectives of multiple activity chart
- To detect the idle time enforced on men and machines and thereby rearranging the work cycle in order to reduce the same.
- To establish the number of machines that may be conveniently manned by an operator
- To reallocate the activities among the workers in order to achieve optimal work distribution
- To combine or eliminate some of the work elements if observed unnecessary
Types of multiple activity chart
- Man-Machine Activity Chart– When one operator is working on one machine
- Multi-man Activity Chart– When a group of workers are working on a machine
- Man- Multi machine activity chart– When a single operator is working on a number of machines
- Multi man- Machine chart: When a group of operators working on a common central machine
Construction of Chart:
- First of all, separate bars or columns are allotted to each subject
- These subjects are placed against a common time scale
- Activities of worker and machine are recorded by shading the respective bars or columns
- Time studies conducted previously provide the time values for each activity
- Now, the activities are plotted in sequence against the common time scale
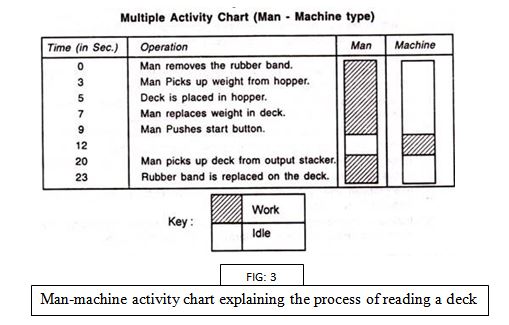
- A man-machine activity chart explaining the process of reading a deck of cards in card reader is drawn in Fig. 3
- After constructing the chart, the first task is to analyze the idle time and always it is tried to minimize it to minimum
- Operations should be simplified to their maximum
- There after work distribution should be optimized between the machines and the operators
An Article by:
National Institute of Fashion Technology